How Hot Do CPUs and GPUs Really Run? Real-World Temperatures from 2,600+ Stress Tests
Real CPU and GPU temperatures from 2,600+ ThermalStats stress tests: median idle and peak temps for desktops and laptops, 80 popular models, how much your cooler really matters, and how room temperature changes the numbers.
Most articles about CPU and GPU temperatures quote the same few ranges and the manufacturers' limits. This one uses measurements instead: 2,603 stress tests run by ThermalStats users on their own PCs and laptops between March and September 2026, recorded by the same open-source tool and cleaned with the rules described under How we measured.
If you want to know whether your temperature is normal, the tables below show what other owners of the same chip actually see. If your model isn't listed, its hardware page may still have results, and a two-minute ThermalStats test will show where your system ranks.
Key Findings
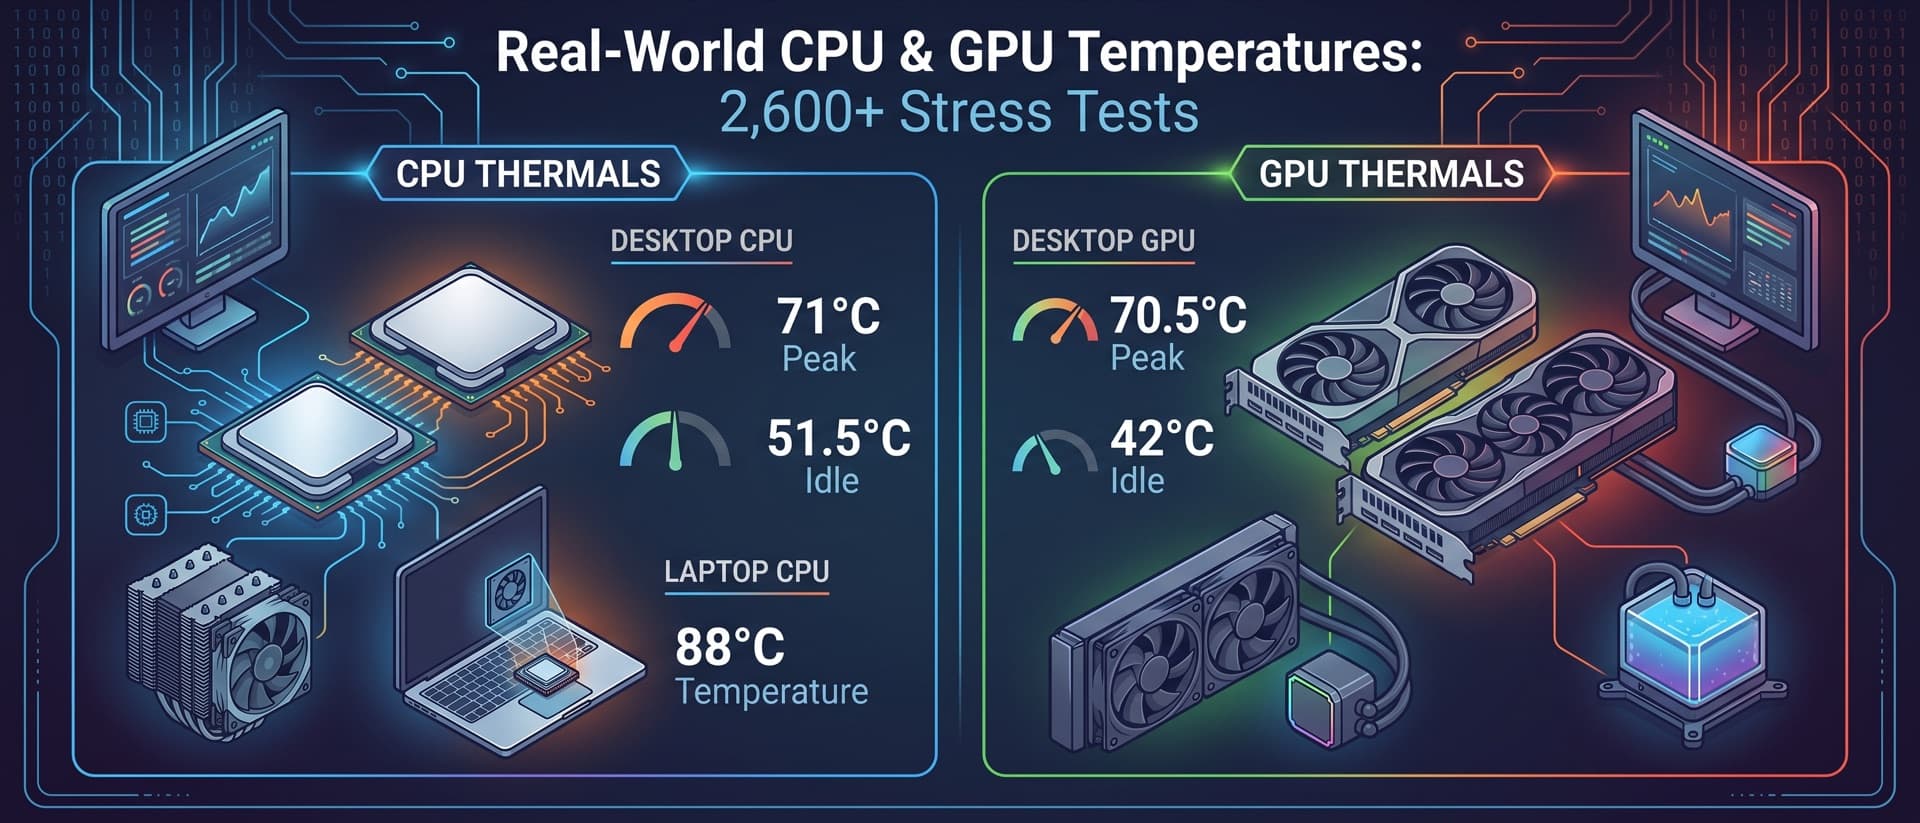
- The median desktop CPU peaks at 71°C under a full stress test and idles at 51.5°C. Only 11% of desktop CPUs reach 90°C.
- Laptop CPUs run about 17°C hotter. The median laptop CPU peaks at 88°C, and 28% reach 95°C or more — usually by design, not because something is broken.
- The median desktop GPU peaks at 70.5°C and idles at 42°C. Fewer than 1% of desktop GPUs reach 90°C. Laptop GPUs peak at a median of 79°C.
- Your cooler matters, but less than the box art suggests. On the same CPU model, stock coolers run 9°C hotter than tower air coolers, while AIO liquid coolers run 3.4°C cooler than tower air.
- The newest X3D chip runs coolest. The Ryzen 7 9800X3D peaks at a median of 68.5°C, about 4°C below the older 7800X3D (72.4°C).
- Room temperature adds less than you might expect. Each extra 1°C in the room added about 0.4°C to GPU peaks and 0.2°C to CPU peaks in our data.
- Longer tests didn't raise the peak. Median CPU peaks were 69–71°C whether the test ran for 60 seconds or 5 minutes.
Desktop vs. Laptop at a Glance
All "peak" figures are the highest temperature reached during a synthetic stress test. That is a worst case — typical gaming temperatures are usually a few degrees lower.
| Median idle | Median peak | Typical range (P10–P90) | Share at 90°C+ | |
|---|---|---|---|---|
| Desktop CPU | 51.5°C | 71.0°C | 55.9–90.9°C | 10.8% |
| Laptop CPU | 63.0°C | 88.0°C | 66.0–98.5°C | 46.7% |
| Desktop GPU | 42.0°C | 70.5°C | 58.0–83.0°C | 0.8% |
| Laptop GPU | 49.0°C | 79.0°C | 62.0–87.0°C | 2.7% |
"Typical range" runs from the 10th to the 90th percentile: 80% of systems fall inside it.
Two things stand out. First, CPUs spread out far more than GPUs. A desktop CPU in the hottest tenth reaches 91°C or more, while GPUs rarely pass the mid-80s. Graphics cards ship with their own large coolers and fairly conservative temperature targets; CPUs depend on whatever cooler and case the owner chose.
Second, laptops are a different world. Almost half of laptop CPUs reach 90°C under full load. Modern mobile chips are designed to boost until they hit a temperature limit (often 95–105°C), so a laptop at 90°C+ during a stress test is usually doing exactly what it was designed to do. For what's actually dangerous, see our guide to safe CPU and GPU temperatures.
CPU Temperatures by Family
Grouping by generation smooths out individual systems and shows which chips run warm by nature. Families shown have at least 15 users.
A few patterns:
- AMD Ryzen 5000 is the coolest popular desktop family at a 66.3°C median across 161 users — mature, efficient chips that are easy to cool.
- Intel 13th Gen desktop chips are the hottest modern family in our data (81.5°C median). Intel 12th Gen (68.2°C) and 14th Gen (74°C) run cooler at the median, but 14th Gen has a long hot tail: one in ten reaches 97°C or more.
- Ryzen 7000 (75°C) runs warmer than Ryzen 9000 (66.9°C), and the X3D versions sit around 71–72°C across three generations. Ryzen 7000's high temperatures are intentional: those chips are designed to boost until they reach 95°C.
Among laptop chips, Intel Core Ultra Series 1 (Meteor Lake) runs hottest at a 98°C median — these chips are allowed to reach 110°C. Intel 8th Gen mobile (84.5°C) is the coolest large laptop family, mostly because older laptops draw less power.
Desktop CPU Temperatures by Model
Every desktop CPU with at least 10 users, sorted from coolest to hottest median peak. Click a model to see its full results page, including every submission and a cooling breakdown.
| CPU | Users | Median idle | Median peak | Typical range |
|---|---|---|---|---|
| Intel Core i5-12400F | 16 | 42.8°C | 56.5°C | 46.5°C – 83.0°C |
| AMD Ryzen 5 5500 | 26 | 46.6°C | 60.5°C | 52.0°C – 69.5°C |
| AMD Ryzen 9 5950X | 12 | 53.2°C | 62.8°C | 56.1°C – 79.5°C |
| AMD Ryzen 7 5700X | 18 | 53.9°C | 63.8°C | 50.1°C – 94.6°C |
| Intel Core i5-10400F | 13 | 44.0°C | 65.0°C | 49.0°C – 82.0°C |
| AMD Ryzen 5 5600 | 22 | 54.5°C | 66.7°C | 58.5°C – 90.8°C |
| AMD Ryzen 5 9600X | 10 | 55.3°C | 67.1°C | 60.1°C – 72.1°C |
| AMD Ryzen 5 5600X | 18 | 52.8°C | 67.3°C | 52.5°C – 84.3°C |
| AMD Ryzen 7 3700X | 17 | 51.8°C | 67.6°C | 61.1°C – 88.4°C |
| Intel Core i7-14700F | 15 | 43.0°C | 68.0°C | 55.0°C – 100.0°C |
| Intel Core i7-12700K | 11 | 43.0°C | 68.5°C | 56.0°C – 78.0°C |
| AMD Ryzen 7 9800X3D | 45 | 49.1°C | 68.5°C | 53.1°C – 79.8°C |
| AMD Ryzen 5 7500F | 11 | 55.4°C | 70.8°C | 46.8°C – 78.1°C |
| AMD Ryzen 9 5900X | 17 | 55.6°C | 71.0°C | 55.1°C – 85.1°C |
| AMD Ryzen 5 3600 | 23 | 55.0°C | 71.3°C | 62.9°C – 84.7°C |
| AMD Ryzen 7 5800X3D | 15 | 51.0°C | 71.5°C | 59.1°C – 84.1°C |
| AMD Ryzen 7 7800X3D | 21 | 58.5°C | 72.4°C | 66.0°C – 75.5°C |
| Intel Core i9-14900K | 10 | 40.5°C | 75.2°C | 45.0°C – 97.0°C |
| AMD Ryzen 9 9950X3D | 16 | 54.1°C | 75.7°C | 61.4°C – 83.8°C |
| AMD Ryzen 5 7600X | 10 | 55.4°C | 76.5°C | 64.9°C – 87.0°C |
| AMD Ryzen 7 5800X | 22 | 59.6°C | 76.8°C | 63.4°C – 90.6°C |
| AMD Ryzen 7 7700X | 12 | 62.5°C | 77.2°C | 64.4°C – 82.8°C |
| Intel Core i7-10700 | 10 | 57.5°C | 83.1°C | 68.0°C – 100.0°C |
The Intel Core i5-12400F is the coolest desktop chip in the table (56.5°C median peak) and the Ryzen 5 5500 is close behind (60.5°C) — both are efficient 65 W parts. At the other end, the Core i7-10700 (83.1°C), Ryzen 7 7700X (77.2°C) and Ryzen 7 5800X (76.8°C) run hottest. The 5800X runs about 13°C hotter than its sibling the 5700X (63.8°C), even though the two chips perform almost identically.
The X3D line tells a clear story:
| X3D CPU | Users | Median peak |
|---|---|---|
| Ryzen 7 5800X3D | 15 | 71.5°C |
| Ryzen 7 7800X3D | 21 | 72.4°C |
| Ryzen 7 9800X3D | 45 | 68.5°C |
| Ryzen 9 9950X3D | 16 | 75.7°C |
The 9800X3D moved AMD's extra cache underneath the CPU cores instead of on top of them, so heat has a shorter path to the cooler. Our users' results match that: it's the newest X3D chip and also the coolest.
Laptop CPU Temperatures by Model
| CPU | Users | Median idle | Median peak | Typical range |
|---|---|---|---|---|
| Intel Core i5-10210U | 12 | 66.8°C | 75.0°C | 68.0°C – 97.0°C |
| Intel Core i5-1035G1 | 10 | 60.0°C | 78.0°C | 69.0°C – 97.5°C |
| Intel Core i5-1235U | 10 | 59.0°C | 78.0°C | 65.0°C – 97.0°C |
| Intel Core i7-1185G7 | 16 | 55.5°C | 79.0°C | 56.5°C – 98.0°C |
| Intel Core i7-8750H | 10 | 59.8°C | 83.2°C | 70.0°C – 96.0°C |
| Intel Core i7-11800H | 15 | 71.0°C | 84.5°C | 72.5°C – 100.0°C |
| Intel Core i7-10750H | 20 | 65.2°C | 87.0°C | 69.0°C – 96.0°C |
| Intel Core i5-13420H | 12 | 73.2°C | 87.2°C | 68.0°C – 98.0°C |
| Intel Core i5-1135G7 | 24 | 59.0°C | 87.2°C | 68.8°C – 96.0°C |
| AMD Ryzen 5 5600H | 15 | 72.0°C | 87.7°C | 69.3°C – 100.3°C |
| Intel Core i5-10300H | 11 | 67.0°C | 89.0°C | 71.0°C – 97.0°C |
| Intel Core i7-13620H | 13 | 59.0°C | 90.0°C | 66.0°C – 99.0°C |
| Intel Core i7-9750H | 16 | 69.5°C | 90.5°C | 70.0°C – 95.0°C |
| Intel Core i7-1165G7 | 13 | 62.5°C | 91.0°C | 68.0°C – 97.0°C |
| Intel Core i5-12450H | 19 | 64.0°C | 91.0°C | 67.5°C – 98.0°C |
| Intel Core i5-11400H | 11 | 60.0°C | 94.0°C | 81.0°C – 98.5°C |
| Intel Core i9-13950HX | 18 | 73.5°C | 94.5°C | 84.5°C – 100.0°C |
| AMD Ryzen 7 5800H | 13 | 69.1°C | 94.9°C | 85.9°C – 100.0°C |
| Intel Core i7-13650HX | 11 | 59.0°C | 96.0°C | 67.0°C – 97.5°C |
Thin-and-light chips (U- and G-series, such as the i5-10210U and i7-1185G7) peak around 75–79°C, while high-performance HX chips like the i7-13650HX (96°C) and i9-13950HX (94.5°C) run close to their limits. Note the high idle figures too: a laptop idling at 60–70°C is common because its fans stay slow and quiet when there's little load.
GPU Temperatures by Family
NVIDIA's RTX 20 Series runs hottest among desktop families (79°C median), while RTX 30 (72°C), RTX 40 (74°C) and RTX 50 (68°C) cluster in the low-to-mid 70s. AMD's RX 7000 and RX 9000 cards report the lowest peaks (62°C and 57°C).
Be careful comparing brands directly. GPUs report different temperature sensors — some the hottest spot on the chip, some a cooler average — and our tool records whichever reading the card provides. Some of the gap between AMD and NVIDIA (and between RTX 40 and RTX 50) likely comes from which sensor each card reports, not only from cooling. Comparisons within a family are reliable; comparisons across brands are rough.
Laptop GPUs are remarkably consistent: every RTX generation lands at 80–81°C, which suggests laptop makers tune their fans and power limits to hold a target temperature, whatever chip is inside.
Desktop GPU Temperatures by Model
| GPU | Users | Median idle | Median peak | Typical range |
|---|---|---|---|---|
| AMD Radeon RX 7900 XT | 10 | 43.5°C | 56.0°C | 49.0°C – 68.5°C |
| AMD Radeon RX 9060 XT | 14 | 40.5°C | 57.0°C | 53.0°C – 64.0°C |
| AMD Radeon RX 9070 XT | 15 | 36.0°C | 57.0°C | 51.0°C – 60.5°C |
| NVIDIA GeForce RTX 3050 | 14 | 40.0°C | 64.2°C | 60.5°C – 71.0°C |
| AMD Radeon RX 7600 | 11 | 39.0°C | 65.0°C | 61.0°C – 73.0°C |
| NVIDIA GeForce GTX 1650 | 16 | 40.0°C | 65.5°C | 45.0°C – 75.0°C |
| NVIDIA GeForce RTX 5070 Ti | 24 | 43.0°C | 66.5°C | 63.5°C – 78.0°C |
| NVIDIA GeForce RTX 5070 | 19 | 40.0°C | 67.0°C | 59.0°C – 76.0°C |
| NVIDIA GeForce RTX 5080 | 15 | 37.0°C | 67.5°C | 51.5°C – 71.0°C |
| NVIDIA GeForce GTX 1050 Ti | 11 | 35.0°C | 67.5°C | 59.0°C – 69.0°C |
| NVIDIA GeForce RTX 3060 | 40 | 45.0°C | 69.0°C | 58.0°C – 82.0°C |
| NVIDIA GeForce RTX 5060 | 22 | 42.8°C | 69.0°C | 64.0°C – 77.0°C |
| NVIDIA GeForce RTX 4060 | 29 | 42.0°C | 69.0°C | 63.0°C – 80.0°C |
| NVIDIA GeForce RTX 5060 Ti | 19 | 36.5°C | 69.0°C | 58.0°C – 74.0°C |
| NVIDIA GeForce RTX 3070 Ti | 11 | 44.5°C | 71.0°C | 59.0°C – 88.0°C |
| NVIDIA GeForce GTX 1060 | 18 | 47.0°C | 72.2°C | 63.0°C – 82.0°C |
| NVIDIA GeForce RTX 3070 | 30 | 42.5°C | 72.5°C | 64.5°C – 78.0°C |
| AMD Radeon RX 580 | 20 | 40.2°C | 72.8°C | 62.0°C – 81.0°C |
| NVIDIA GeForce RTX 4060 Ti | 14 | 41.5°C | 73.0°C | 66.0°C – 76.0°C |
| NVIDIA GeForce RTX 3080 | 17 | 45.0°C | 74.0°C | 63.0°C – 79.0°C |
| NVIDIA GeForce GTX 1660 SUPER | 17 | 44.0°C | 75.0°C | 65.0°C – 84.0°C |
| NVIDIA GeForce RTX 3060 Ti | 27 | 43.0°C | 76.0°C | 53.5°C – 85.0°C |
| NVIDIA GeForce RTX 4070 SUPER | 12 | 39.5°C | 77.0°C | 66.0°C – 84.0°C |
| NVIDIA GeForce RTX 3090 | 13 | 41.0°C | 78.0°C | 67.0°C – 88.0°C |
| NVIDIA GeForce RTX 4070 Ti | 12 | 41.0°C | 78.5°C | 70.0°C – 86.0°C |
| NVIDIA GeForce RTX 2060 | 22 | 42.0°C | 80.0°C | 66.0°C – 85.0°C |
| NVIDIA GeForce RTX 2070 SUPER | 10 | 43.0°C | 83.0°C | 77.0°C – 85.0°C |
The RTX 3060 (40 users, 69°C) and RTX 3070 (30 users, 72.5°C) are the best-covered cards and sit right at the desktop median. The RTX 2060 (80°C) and RTX 2070 SUPER (83°C) run hottest — five-plus-year-old cards whose fans and thermal paste are likely due for cleaning or replacement. Among current NVIDIA cards, the RTX 5070, 5070 Ti and 5080 all sit around 67°C.
Laptop GPU Temperatures by Model
| GPU | Users | Median idle | Median peak | Typical range |
|---|---|---|---|---|
| NVIDIA GeForce GTX 1650 | 34 | 50.5°C | 75.0°C | 65.0°C – 87.0°C |
| NVIDIA GeForce RTX 4050 Laptop GPU | 30 | 46.0°C | 76.5°C | 62.0°C – 84.0°C |
| NVIDIA GeForce RTX 5060 Laptop GPU | 11 | 53.0°C | 78.0°C | 69.0°C – 89.0°C |
| NVIDIA GeForce RTX 3060 Laptop GPU | 25 | 45.0°C | 79.0°C | 63.0°C – 87.0°C |
| NVIDIA GeForce RTX 3050 | 10 | 48.5°C | 79.0°C | 62.0°C – 87.0°C |
| NVIDIA GeForce RTX 2050 | 11 | 52.0°C | 80.0°C | 70.0°C – 87.0°C |
| NVIDIA GeForce RTX 4060 Laptop GPU | 32 | 45.8°C | 81.0°C | 65.0°C – 86.5°C |
| NVIDIA GeForce RTX 3050 Laptop GPU | 31 | 54.5°C | 81.0°C | 61.0°C – 87.0°C |
| NVIDIA GeForce RTX 4090 Laptop GPU | 13 | 49.0°C | 82.0°C | 81.0°C – 89.0°C |
| NVIDIA GeForce RTX 3050 Ti Laptop GPU | 13 | 54.0°C | 83.0°C | 61.0°C – 89.0°C |
| NVIDIA GeForce RTX 2060 | 11 | 48.0°C | 83.5°C | 68.0°C – 88.0°C |
How Much Does Your Cooler Really Matter?
This is where raw averages mislead. Compare all users by cooler type and you get this:
At first glance, an AIO looks only 2°C better than a tower air cooler. But people buy AIOs for their hottest, most power-hungry CPUs, so that comparison mixes very different chips. Comparing users who have the same CPU model gives a fairer answer:
| Cooler type (same CPU model) | Difference vs. tower air | CPU models compared |
|---|---|---|
| Stock cooler | +9.0°C hotter | 17 |
| AIO liquid cooler | −3.4°C cooler | 22 |
| Custom water loop | −5.9°C cooler | 5 (small sample) |
What this means in practice:
- Upgrading from a stock cooler is the biggest win — about 9°C on the same chip, usually for the price of a $30–40 tower cooler.
- Going from a good air cooler to an AIO buys about 3–4°C. Worth it for hot-running chips like Intel 13th/14th Gen or Ryzen 7000; hard to justify on a Ryzen 5 5600. Our air cooler vs. AIO guide covers the trade-offs.
- Custom loops are coolest, but we only have enough matched pairs for a rough estimate.
Which coolers do our users run? Of the 265 desktop users who named their cooler, the most common brands were Thermalright (31), Arctic (25), Noctua (23), Corsair (19), be quiet! (18), Cooler Master (14) and DeepCool (10). We don't rank brands by temperature: each brand's buyers own different CPUs, so the averages would mostly reflect the chips, not the coolers.
Which Laptop Lines Run Hottest?
For laptop lines with at least 10 users, here is the median CPU peak:
Acer Nitro (82.2°C) and Lenovo IdeaPad/ThinkPad/Yoga (86°C) run coolest; Dell Precision/Latitude/XPS (98.5°C) runs hottest. The Dell result makes sense: those are thin business and creator machines that put a powerful CPU in a slim chassis and let it run up to its temperature limit. Gaming lines — ASUS ROG and TUF, MSI, Lenovo Legion and LOQ, HP Victus — cluster between 90°C and 94°C.
The GPU picture is tighter: every line sits between 72°C (Acer Nitro) and 83.5°C (ASUS TUF). If your laptop is hotter than its line's typical range, our laptop cooling guide explains when repasting or a cooling pad actually helps.
Does Room Temperature Matter?
Yes, but less than the common "1°C in the room = 1°C on the chip" rule suggests.
Among desktop users who reported their room temperature, each extra degree added about 0.4°C to GPU peaks and 0.2°C to CPU peaks. A likely reason: modern CPUs and GPUs boost their clock speeds until they reach a temperature or power limit. In a hot room they spend some of that headroom on lower clocks instead of higher temperatures — so heat costs a little performance as well as degrees. Our summer cooling guide has fixes that don't require new hardware.
Does a Longer Stress Test Change the Result?
Not much at the peak. Desktop CPU medians were 70°C for 60-second tests, 71.2°C for 2 minutes, 69.1°C for 3 minutes and 71.2°C for 5 minutes. Most of the temperature rise happens in the first few seconds, and the typical desktop CPU comes within 2°C of its peak after about a minute. See how fast PCs heat up for the second-by-second data.
That doesn't make long tests pointless. A longer run catches problems that take time to build up — a slowly heat-soaking case, a pump that can't keep up, or thermal throttling after several minutes — so we still recommend at least 2 minutes.
How Does Your PC Compare?
The tables above are medians. Your own system could be well above or below them because of its cooler, case airflow, dust, thermal paste age, or room. The quickest way to find out:
- Download the free ThermalStats CLI for Windows or Linux (macOS coming soon). It's open source and runs in your language.
- Run a 2-minute test. It reads your real CPU and GPU sensors under a full load.
- See where you rank against other owners of the same CPU and GPU, with a percentile, a cooling comparison, and recommendations if you're running hot.
Every test also makes this report more accurate for the next reader. Models that are missing today — Apple Silicon, Intel Arc, the RX 7900 XTX — need only 10 users each to get a row in the next update.
How We Measured
- Source: 2,603 submissions from the ThermalStats CLI between March 18 and September 24, 2026. Only CLI results are included, because the CLI reads hardware sensors directly.
- "Peak" temperature is the highest reading during a synthetic stress test (usually 2 minutes; users can choose any length from 30 seconds up). The CPU test runs one heavy thread per core; the GPU test runs a compute workload. Peaks are worst-case figures, typically a few degrees above gaming temperatures.
- Sensors: CPU readings use the package temperature (Tctl/Tdie on AMD). GPU readings use the hotspot sensor when the card and driver expose one and the core sensor otherwise, so GPU comparisons across brands and generations are approximate.
- Cleaning: CPU figures come only from CPU or combined tests, and GPU figures only from GPU or combined tests. We removed runs where the stressed part never passed 50% utilisation, and readings that are physically implausible for that chip.
- One user, one vote: if someone tested the same model several times, their runs count once, at their median. After cleaning, the report covers 1,650 CPU and 1,151 GPU results from distinct users.
- Laptop vs. desktop is decided by the hardware (mobile CPU or laptop GPU) as well as what the user selected.
- Minimum sample: a model needs at least 10 distinct users to appear in a table, and a family needs 15 to appear in a chart.
- Self-reported fields (cooler type, room temperature, laptop model) are as entered by users; we grouped spelling variants of laptop lines and cooler brands.
This report is updated quarterly. The numbers above reflect data through September 24, 2026.
Use This Data
The model tables are available as a CSV download under the Creative Commons Attribution 4.0 (CC BY 4.0) licence. You're free to use them in articles, videos, forum posts and research. Please credit ThermalStats and link to this page.
Suggested citation: ThermalStats, "How Hot Do CPUs and GPUs Really Run? Real-World Temperatures from 2,600+ Stress Tests", September 2026, https://thermalstats.com/blog/real-world-cpu-gpu-temperatures.
Frequently Asked Questions
What is a normal CPU temperature under load?
For a desktop, a peak of 56–91°C under a full stress test is normal; the median is 71°C. For a laptop, 66–98.5°C is normal, with a median of 88°C. Games usually run a few degrees below these stress-test peaks.
What is a normal GPU temperature under load?
Desktop graphics cards typically peak at 58–83°C (median 70.5°C). Laptop GPUs typically peak at 62–87°C (median 79°C). Fewer than 1% of desktop GPUs in our data reached 90°C.
What is a normal idle temperature?
The median desktop CPU idles at 51.5°C and the median desktop GPU at 42°C. Laptops idle warmer — about 63°C for the CPU and 49°C for the GPU — because their fans stay slow at light load.
Is 90°C too hot for a CPU?
For a laptop, not necessarily: nearly half of laptop CPUs reach 90°C in a stress test, and most are designed to run there. For a desktop, 90°C puts you in the hottest 11% of systems — not dangerous for most modern chips, but a sign that your cooler, airflow or thermal paste has room to improve. See safe CPU and GPU temperatures for chip-specific limits.
Does an AIO cool better than an air cooler?
On the same CPU model, AIO users in our data ran 3.4°C cooler than tower air cooler users. Both are far better than a stock cooler, which ran about 9°C hotter than tower air.
Which desktop CPUs run coolest?
Among CPUs with at least 10 users, the Intel Core i5-12400F (56.5°C median peak), AMD Ryzen 5 5500 (60.5°C) and Ryzen 9 5950X (62.8°C) ran coolest. The Core i7-10700 (83.1°C) and Ryzen 7 7700X (77.2°C) ran hottest.
How can I compare my own temperatures?
Run the free ThermalStats CLI. It stress tests your CPU and GPU, reads the real sensors, and shows how your results compare with other owners of the same hardware.
Related guides:
- Safe CPU & GPU Temperatures — What's normal, what's too hot, and when to worry
- Air Cooler vs AIO Liquid Cooling — Which upgrade is worth it
- Laptop Cooling Strategies — Repasting, cooling pads, and brands
- Undervolting Your CPU & GPU — Lower temps without losing performance
- PC Case Airflow Guide — Getting heat out of the case
Be the First to Know
We're launching the ThermalStats newsletter soon — thermal tips, cooling guides, and data insights straight to your inbox. Sign up now to be first in line.
No spam, ever. Unsubscribe anytime.